A marketing campaign’s value is based on its contribution to sales growth and its associated costs, both of which are identifiable with retailer POS data. Although the weighting of sales growth and costs varies between brands and over time, the quantified value of a marketing campaign should not be a mystery.
Retailer POS data is an incredible resource to measure and improve the success of marketing campaigns. Whether it’s a promotion at the store shelf or a regional influencer campaign that is expected to trigger an increase in regional sales, retailer POS data provides brands the ability to quantify the value of their various marketing campaigns so they can double-down on what works, launch campaigns at the most opportune times, and eliminate the ones that just burn cash.
To ensure all emerging brands have a fighting chance, Snowrise is highlighting critical marketing insights that brand leadership and teams should leverage to maximize the sales from their marketing campaign dollars. If your brand has retailer POS data, then these insights are within reach and able to greatly benefit your sales and cash flow.
Pre, During, and Post Campaign Sales Impacts
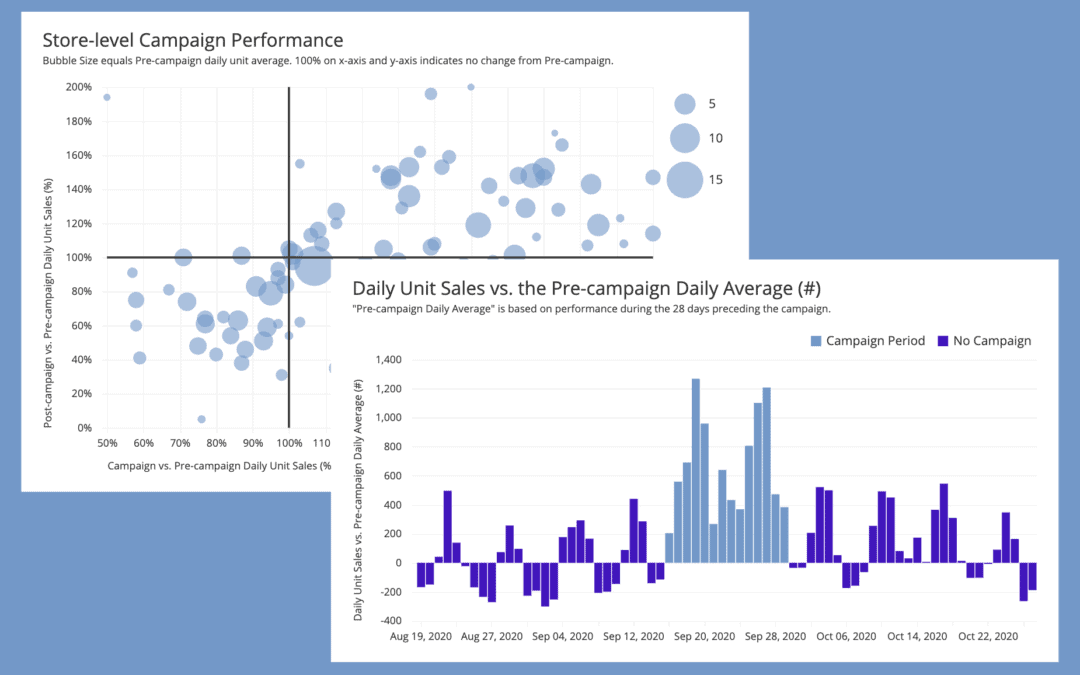
Sales velocity growth during a campaign is quantifiable and provides an initial view into a campaign’s success, however, the Post vs. Pre campaign comparison also needs/can be calculated to truly understand the overall benefit of the campaign. A marketing campaign that generated 100% sales growth during the campaign doesn’t look as good if it cannibalized sales from the weeks following the campaign. On the flip-side, a campaign with 50% sales growth and a Post vs. Pre unit velocity growth of 20% might be gold for you and your brand.
Pre, during, and post campaign velocity measurements at the division, store, and product-levels are also obtainable and allow for deeper insights into what/where the campaign is working. These deeper insights enable future marketing campaigns to be adjusted based on end-consumer behaviors to conserve cash, drive up a particular product’s velocity, or achieve another goal. And in the case of promotions, POS data can even be used to identify stores where promotion tags weren’t posted based on the lack of velocity improvement relative historical performance and other stores.
Campaign Cost Profile
Assuming costs are a concern (and for most they are), quantifying total campaign costs and associated ‘per unit’ impact is achievable with retailer POS data. For promotions, variable costs can be calculated directly from the total unit sales during the promotion period. All other costs, whether tied to a promotion or other campaign type, should be known and the ‘per unit’ impact calculated based on the incremental unit sales that occurred during and post the campaign.
A/B Campaign Comparisons
Side-by-side campaign comparisons, also achievable with retailer POS data, allow brands to optimize the what, when, where, and how much for each of their marketing campaigns based on the above mentioned metrics. All else being equal, time of year and geography influence the performance of a marketing campaign, and understanding where and when you should activate a campaign is a strategic advantage.
At the macro-level, recognizing the marketing campaign type(s) that trigger the greatest response for your brand’s end-consumer is critical. Even if a campaign type is not an in-store promotion, the timeframe and geography of the marketing campaign’s scope (ex. location-based advertising) can be leveraged to quantify both the benefit and cost from the retailer’s POS data. With store-level POS data, any campaign type that can be targeted based on geography (ex. Facebook ads, regional influencers, radio) allows for small-scale testing that can then be expanded if the performance meets/exceeds expectations.
Recent Comments